Have you ever wanted to figure out how well your business is doing financially and not sure how to piece all of the information together in one area? This is easily done by using a dashboard containing financial key performance indicators, which are measurable values that can indicate how well a company is doing regarding generating revenue or profits. When you start monitoring KPIs, you can see if your business is achieving its long-term goals. Here are four ways to build your financial dashboard using key performance indicators.
What are your Financial Goals?
Before you can determine what would need to be on your financial dashboard, you would need to determine what your overall financial goals are. Once you determine goals, you set your dashboard to measure things like profits, revenues, and costs. These measurements let you know where you are after the previous month in relation to your set goals and how far you are away from meeting your expectations.
What Metrics Should you use?
When setting up your dashboard, you want to choose metrics that are going to provide a broadened view of the organization’s financial health. The parameters that companies use will vary, but the most common are profit, cash flow, and revenue. There are a few things you want to keep in mind, including not displaying an overwhelming amount of data and summarizing and interpreting the numbers, not just reporting them. You want to keep everything high-level but have the ability to drill down further into details when needed. You have to ask yourself who is going to be reviewing the dashboard and what numbers matter to them, and where will it be published? For nonprofit businesses or a municipality, you would want to have information displayed regarding how donations or taxes are being used in a measure that is easily understood.
Track Performance and Report it
The main objective of a financial dashboard is to report financial health and performance. In the end, you could have a dashboard that displays trends over a period of time or one that simply tells a story for the accounting period you are looking at. It is ideal to track revenue and your net income over time to be able to better understand the important trends in your organization. Another thing that you should be reporting on is targets. Including your financial targets in your reporting allows you to see where you are succeeding or failing in your plans. This allows people to see where you are excelling and where you need to make more strategic decisions in areas that you are struggling with. Some companies use red, amber, and green status indicators to quickly display if the measure is above or below the plan.
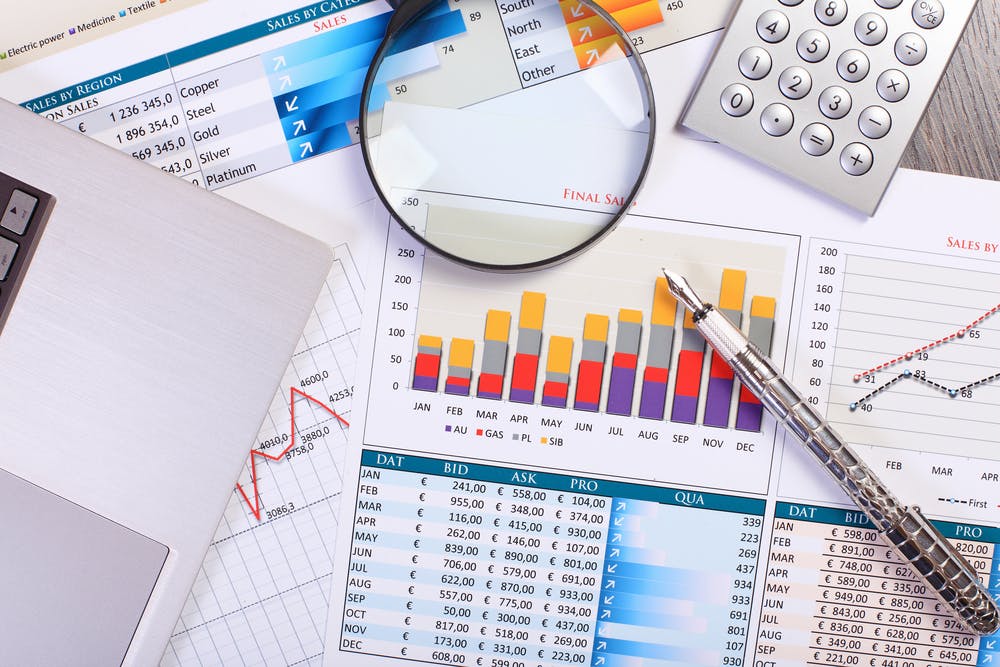
Tracking With Charts
Using charts on your dashboards are the best thing to use as visual aids. Having charts allows your users to be able to understand the metrics easier, versus writing about how your business is performing. You want to make sure your chart choices are designed to best communicate the story you are telling with your numbers. Keep the fonts and colors similar, if possible, but pick the right type of display for the data. So trend lines might be shown as a line graph, but percentage of revenue by line of business might be easier to digest as a pie or donut chart. Whatever format you use to display data, however, be consistent in how you color code it – don’t make red represent poor results on one chart, and positive results on another!
Your financial dashboards measuring up to your needs is key to financial success. This can be easily done by financial key performance indicators, which are measurable values that can indicate how well a company is doing regarding generating revenue or profits. When you start monitoring KPIs, you can see if your business is achieving its long-term goals. The four ways listed above are the easiest ways to build your financial dashboard using key performance indicators.


